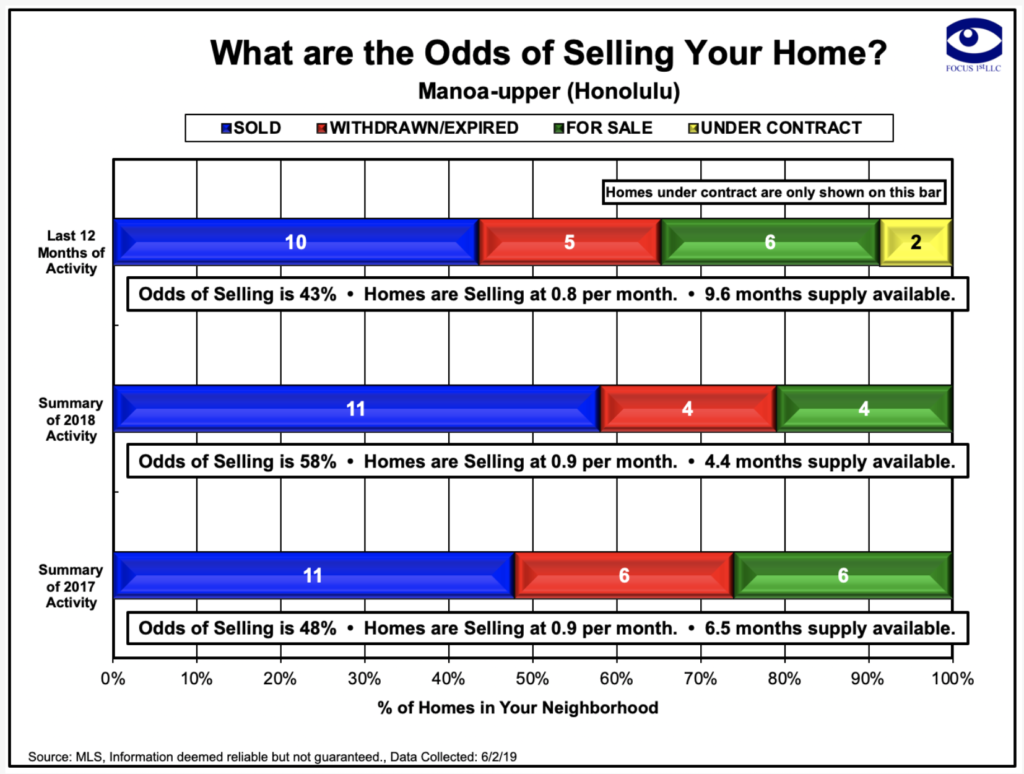
In this chart, we can see the “Odds of Selling Your Home.”  It is based on the last 2 years of sales in Manoa-Upper.  We can see our odds of selling, in the past 2 years, has been between 48 and 58%.  Homes are selling at an average rate of .9 per month and this gives us a supply of 4-6 months.  6 months of supply is considered a balanced market.  Anything less than this amount is considered a seller’s market and above is a buyer’s market.

Each dot in this Seasonal Buying Patterns chart represents one of the 11 homes sold in 2018.  We can see they are pretty well spread out thru the 1st three quarters of the year, with the main cluster between June and September.  This is typically referred to as the “summer selling season.”  It is also important to not there were not any closings in the 4th quarter, which underlines the importance of getting it sold in the summer.

“The Pond” chart illustrates the concept of a market… where properties are coming on the market and going off the market at specific rates.  In the past 3 months, 6 new properties came on the Manoa-Upper market.  There were only 3 sold in this same time period.  They are coming on the property twice as fast as they are selling.

In this pond chart, we see the “projected activity” in the next 3 months (Summer selling season).  It is projected that 6 new properties will come one, but 5 will sell… a much higher rate! 

On average, it took 100 days to sell a property in Manoa Upper in 2018.  This is an average and underlines the importance of good preparation, good marketing and pricing the property well to ensure it doesn’t sit on the market long.